Your native compiler can optimize an app more effectively when it knows which code actually runs. Profile-guided optimization, or PGO, gives it that information. The build service runs an instrumented version of your application, records its execution and uses the profile to compile the binary your users receive.
PGO is now a Pro and Enterprise cloud-build feature for iOS, native macOS and native Linux. You enable it with a build hint; the service handles the extra compilation and training. It is a way to improve native performance without rewriting application logic or managing a profiling pipeline yourself.
This release also adds adaptive generational garbage collection to ParparVM. We will start with PGO and how to use it, then look at the GC changes and the memory cost behind their CPU improvements. This continues our weekly release series and last week’s object-layout work.
Let your app guide the compiler
An ordinary optimizing compiler has to estimate which branches are common and which functions are worth inlining. PGO replaces some of those estimates with counts from an actual run. Frequently executed code can be placed together and optimized for speed, while code outside those paths can stay compact.
The profile applies to translated Java, Codename One’s runtime and your native sources. The instrumented binary stays on the build server. Your users receive the second build, without the training counters.
Turn on PGO for your target
Add the relevant hint to codenameone_settings.properties. This example enables it for iOS and sets a 90-second training period:
codename1.arg.ios.pgo=true
codename1.arg.pgo.trainingSeconds=90
Each target has its own switch:
| Build hint | Target | Training environment |
|---|---|---|
codename1.arg.ios.pgo=true | iOS device app | Temporary iOS simulator on the build server |
codename1.arg.macos.pgo=true | Native macOS app | Build server |
codename1.arg.linux.pgo=true | Native Linux app | Build server with a virtual display |
The training period defaults to 60 seconds. Values below 10 or above 300 are brought into that range. Increasing it gives the application longer to exercise its startup work; it does not create user interactions.
If you already subscribe to Pro or Enterprise, enable the hint and submit a supported cloud build. PGO is included in those plans. You can compare plans here. These hints belong to the cloud build service; local builds do not consume them.
Give the training run useful work
The app starts from a clean state and runs unattended. Resource loading, initial layout and painting can contribute to the profile, as can animations, timers and network work that start automatically. Repeated work is particularly useful because the compiler can identify the paths that dominate execution.
Nobody signs in or taps a button during training. If the app stops at a login screen, the profile describes that screen. Code behind it remains correct, but the compiler has no evidence that it is an important execution path. Before enabling PGO, run the app from a clean installation and check what it does without input.
PGO adds build time because it requires two compilations and a training run. Start with a normal Release build and record the time for a representative task. Repeat that task with the profile-guided build on the same device. Check memory and the result of the task as well as elapsed time. The gain depends on how much of your workload the training run reached; we are not assigning a universal speedup percentage to it.
A requested profile-guided build either produces that binary or fails with a reason. An empty profile, a crash during training or an incompatible build mode does not silently produce an ordinary build. The performance guide lists the settings, training rules and incompatible configurations, including debug and simulator-only modes. PR #5945 introduced the build support.
Adaptive GC reduces the work left to run
PGO improves the generated native code. The collector changes reduce how much work that code needs to do. In our allocation workload, the concurrent collector spent time tracing fresh objects and sweeping their slots even when almost none survived.
ParparVM now has an adaptive generational phase. Holding more memory can reduce collection frequency, but it can also make the next full trace or transition much worse. The standard Codename One benchmarks use no PGO, so the following GC results measure the runtime changes separately.
Collect survivors instead of revisiting every allocation
A generational collector concentrates frequent work on young objects, based on the observation that many die quickly. References from older objects to young ones must still be tracked, and surviving objects cannot simply disappear when a young page is reset.
Our hybrid chooses between the existing concurrent path and stop-the-world generational cycles. On eligible multicore processes, it enters after repeated low-survival cycles with allocation demand and a concurrent collector busy for at least half the interval between cycles. Low available memory is an exit condition, not the trigger to enter.
An all-dead young page can be reset in constant time. The allocator’s bump path is inline again, and accounting moves from each object to each page where possible. Those changes remove work rather than merely asking another CPU to do it.
A process that has created virtual threads stays concurrent. A registered native thread that the collector cannot hold also prevents these stop-the-world cycles. Pausing only some allocating threads is not a valid stop-the-world algorithm. The runtime implementation enforces those boundaries.
More memory can buy fewer collections
The young-generation budget responds to collection duty. Two successive minors consuming more than 5% of their intervals can grow it; below 1%, it can shrink. Growth is bounded, including by a fraction of host memory. Requiring two busy minors avoids treating one collection delayed by the OS scheduler as proof that the application needs a larger heap.
A larger young generation lets more short-lived objects die before the next collection. That can save CPU. It also leaves more memory resident, and increases the amount of work a later phase may inherit. You have to measure both sides.
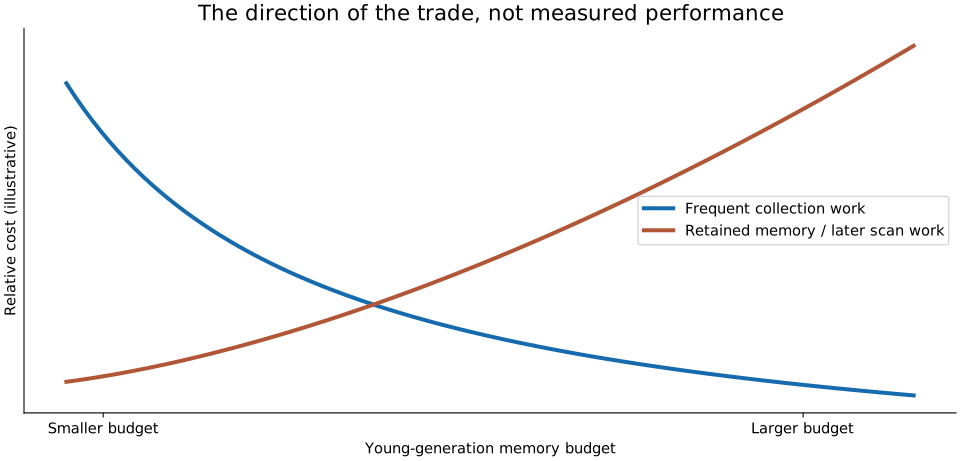
Conceptual diagram, not benchmark data. Increasing a budget can reduce frequent collection work while increasing retained memory and the cost of a later scan. The actual curves depend on survival and reference patterns.
One failed transition made this concrete. Deferring the exit decision until the next cycle handed as much as 128 MB of young objects to a concurrent collection. Its fresh-object protection retained them, while application threads kept allocating behind it. The engineering record reports a roughly 500 ms cycle and a page-heap count rising from 3,446 to 10,538 in the affected stress test. The exit decision now runs at the end of the stopped cycle, before application threads resume.
Another attempted concurrent major promoted about 6.4 million dead objects into the old generation. The next minor then spent 260 to 305 ms examining the remembered set. Those are failure observations from the GC engineering record, not advertised pause bounds for the corrected collector.
Read time and memory together
The committed calibration change for PR #5940 gives a useful view of the trade. These are historical gate baselines for objectAllocation, with JDK 25 equal to 1. Lower is better in both columns.
| Runner | Time ratio, before → after | Peak memory ratio, before → after |
|---|---|---|
| macOS ARM64, three-CPU runner | 3.696 → 1.106 | 0.481 → 0.937 |
| Linux x64, AMD EPYC 7763 | 5.011 → 1.649 | 0.370 → 0.370 |
| Linux ARM64, Neoverse N2 | 3.043 → 3.043 | 0.239 → 0.378 |
| Windows x64, AMD family 25/model 1 | 4.932 → 1.559 | 0.400 → 0.386 |
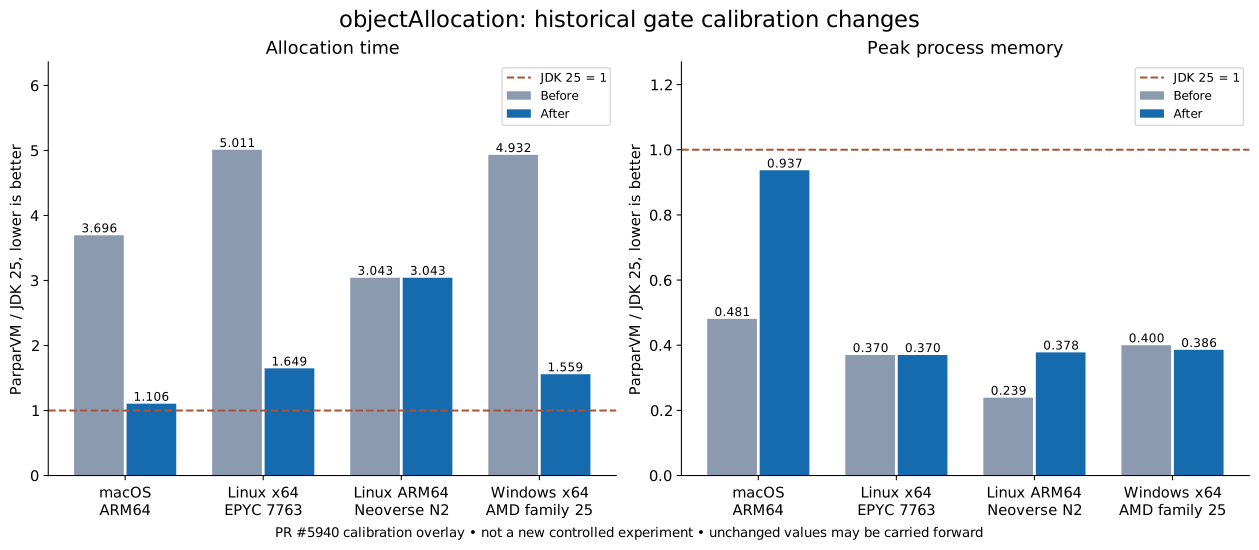
The macOS row is the clearest cost: much less allocation time, almost twice the previous memory ratio. Linux ARM64 records more memory with its time baseline unchanged. A value unchanged in the overlay can be a carried-forward baseline; it is not a fresh measurement of zero change. The ratios still show ParparVM slower than JDK 25 on this allocation workload after the improvement.
These are calibration records, not a new controlled before/after experiment. Most selected rows record one calibration run; the Windows row records three. They have no confidence intervals, and later master baselines include further recalibrations. The data CSV and original overlay retain that context. Compare within a runner row; do not rank different machines from these ratios.
The allocation workload is deliberately narrow. It tells us about allocation and collection behavior for that survival pattern, not frame latency, network throughput or every application. A backend using virtual threads also follows the concurrent path, so an allocation microbenchmark’s hybrid gain cannot be assigned to that backend.
Make a speed gain part of the next baseline
The performance gate runs paired ParparVM and JDK 25 workloads on Linux x64 and ARM64, Windows x64 and ARM64, and macOS ARM64. It alternates which runtime goes first, verifies output and records median ratios. CPU-specific baselines keep one runner model from silently standing in for another.
For workload timings, the gate uses the fastest measured repetition inside each process; JVM startup is not charged to the workload. Memory is a process peak: footprint on macOS, RSS on Linux and working set on Windows. Those are related measurements, not identical operating-system counters.
A change outside the permitted tolerance fails in either direction. A large improvement needs a reviewed baseline update too, otherwise a later regression could give it back while remaining below the old limit. Each PR owns an overlay, records a reason for an intentional change and names the value it replaces. Merged overlays are folded without changing the resolved baseline.
# Run locally on the appropriate platform and inspect both metrics.
vm/selfhost/ci-perf-gate.sh run macos-arm64 /tmp/cn1-perf
vm/selfhost/ci-perf-gate.sh verdict /tmp/cn1-perf
This comparative gate covers the five host OS/architecture combinations above. It is not a JDK comparison running on an iPhone, Android device or browser. Those ports have their own behavior and screenshot coverage. The port status page exposes the distinction, and PR #5930 explains the baseline workflow.
Keep the gain you measured
PGO and adaptive collection improve different parts of execution. Compare a profile-guided build with a regular build using the same application workflow, and keep the time and memory results together. For compiler and runtime changes, the performance gate gives the next release a baseline to preserve.
Discussion
Which part of your app would benefit most from a profile-guided build: startup, rendering, or repeated background work?